
Knoedler Stock Books: Buyer and Seller Locations
In this series of posts, I delve into the Getty Research Institute's Knoedler Stock Books dataset, which contains over 40,000 sales records from the stockbooks of art dealer M. Knoedler & Co. dating from 1872–1970.
Visualizing Buyer and Seller Locations
Another inquiry that might be fruitful is looking for patters in where artworks originated geographically and where they ended up. Such knowledge would provide some insight into the ways in which Knoedler facilitated the movement of artworks internationally. My hypothesis is that we’ll largely see movement from Europe to the U.S., but where specifically? Did this change over time?
Cleaning the Data
Unlike assessing transaction volume, which relied on the mostly clean and standardized entry_date_year and sale_date_year features of the dataset, here we’re looking at seller_loc_1 and buyer_loc_1, which are far messier. (Incidentally, the ‘1’ appended to the end of each of those column names speaks to the fact that, in rare cases, an artwork had more than one buyer and/or more than one seller, so there are additional columns to capture this information. For our purposes here, I’m going to focus on the first buyer/seller, both because I am making an assumption that the first name listed is the primary one and also because the situations in which there are more than one buyer/seller are comparitively rare.) To prepare the dataset for this question, then, the first step was to clean these two fields. I used OpenRefine to do this, standardizing the two location features in question as sell_auth_loc_1_single and buy_auth_loc_1_single, each of which follows a standard format: City, [State,] Country. After cleaning, there were a total of 23,476 records with valid seller locations and 27,198 records with valid buyer locations.
Buyer and Seller Locations: All Time
This first chart is easy: I extracted country names from the cleaned buyer and seller location columns I made, and then counted up the vales.
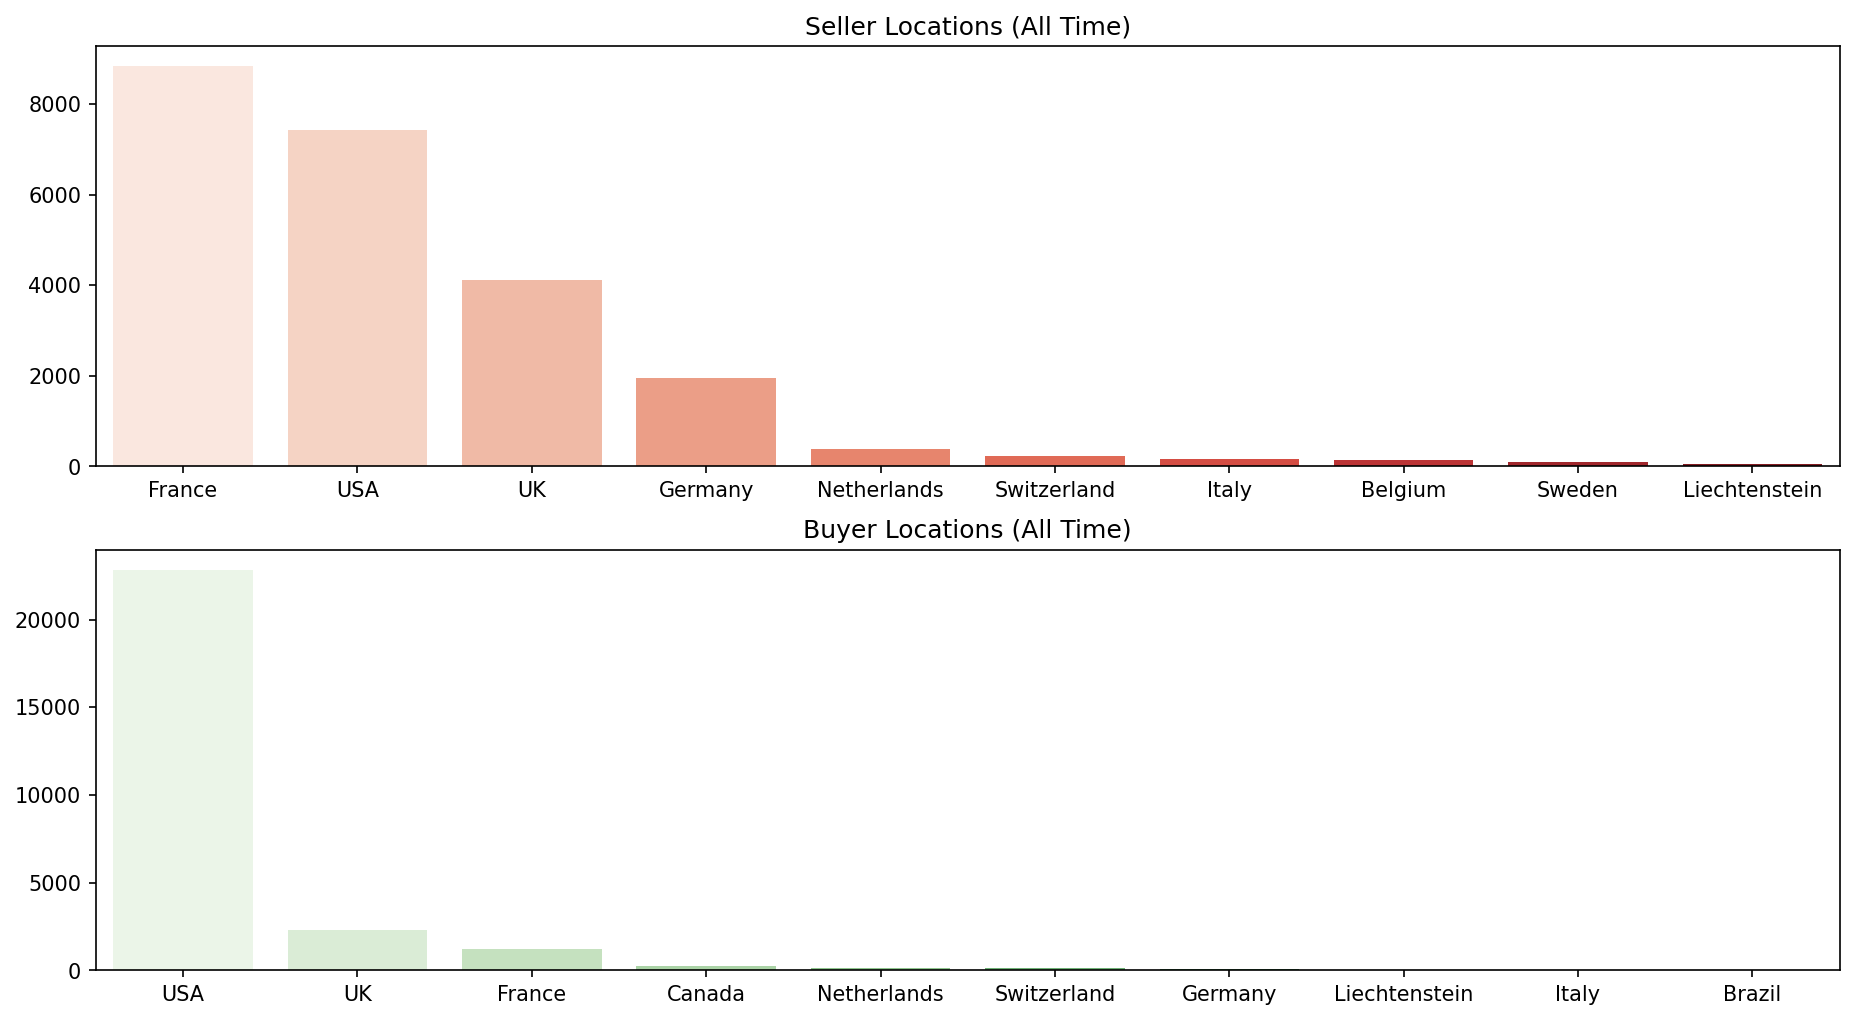
It couldn’t be any clearer that the vast majority of the dealer’s inventory originated in France and the US, with still-substantial numbers of purchases made from the UK and Germany; whereas it did almost all of its selling in the US–unsurprising for a New York City-based dealer, but there you go.
Buyer and Seller Locations: Trends Over Time
The charts above reflect the dealer’s overall transactions. But what if we wanted to get a sense for whether they changed over time? For this we’ll need to incorporate entry_date_year (to match with our seller locations) and sale_date_year (to match with buyer locations). And then we’ll want to see how much of the dataset has these valid pairings to make sure there’s adequate representation:
- Valid entry date/seller location pair: 23,097 records (of 23,476 with seller location only)
- Valid sale date/buyer location pair: 26,836 records (of 27,198 with buyer location only)
This is what we like to see: Almost every record with a valid seller location has a matching entry date in the stock books, and almost every record with a valid buyer location has a matching sale date. In that case, let’s re-slice the original dataset so we can have location information and date information.
Now for a heatmap to visualize the results:
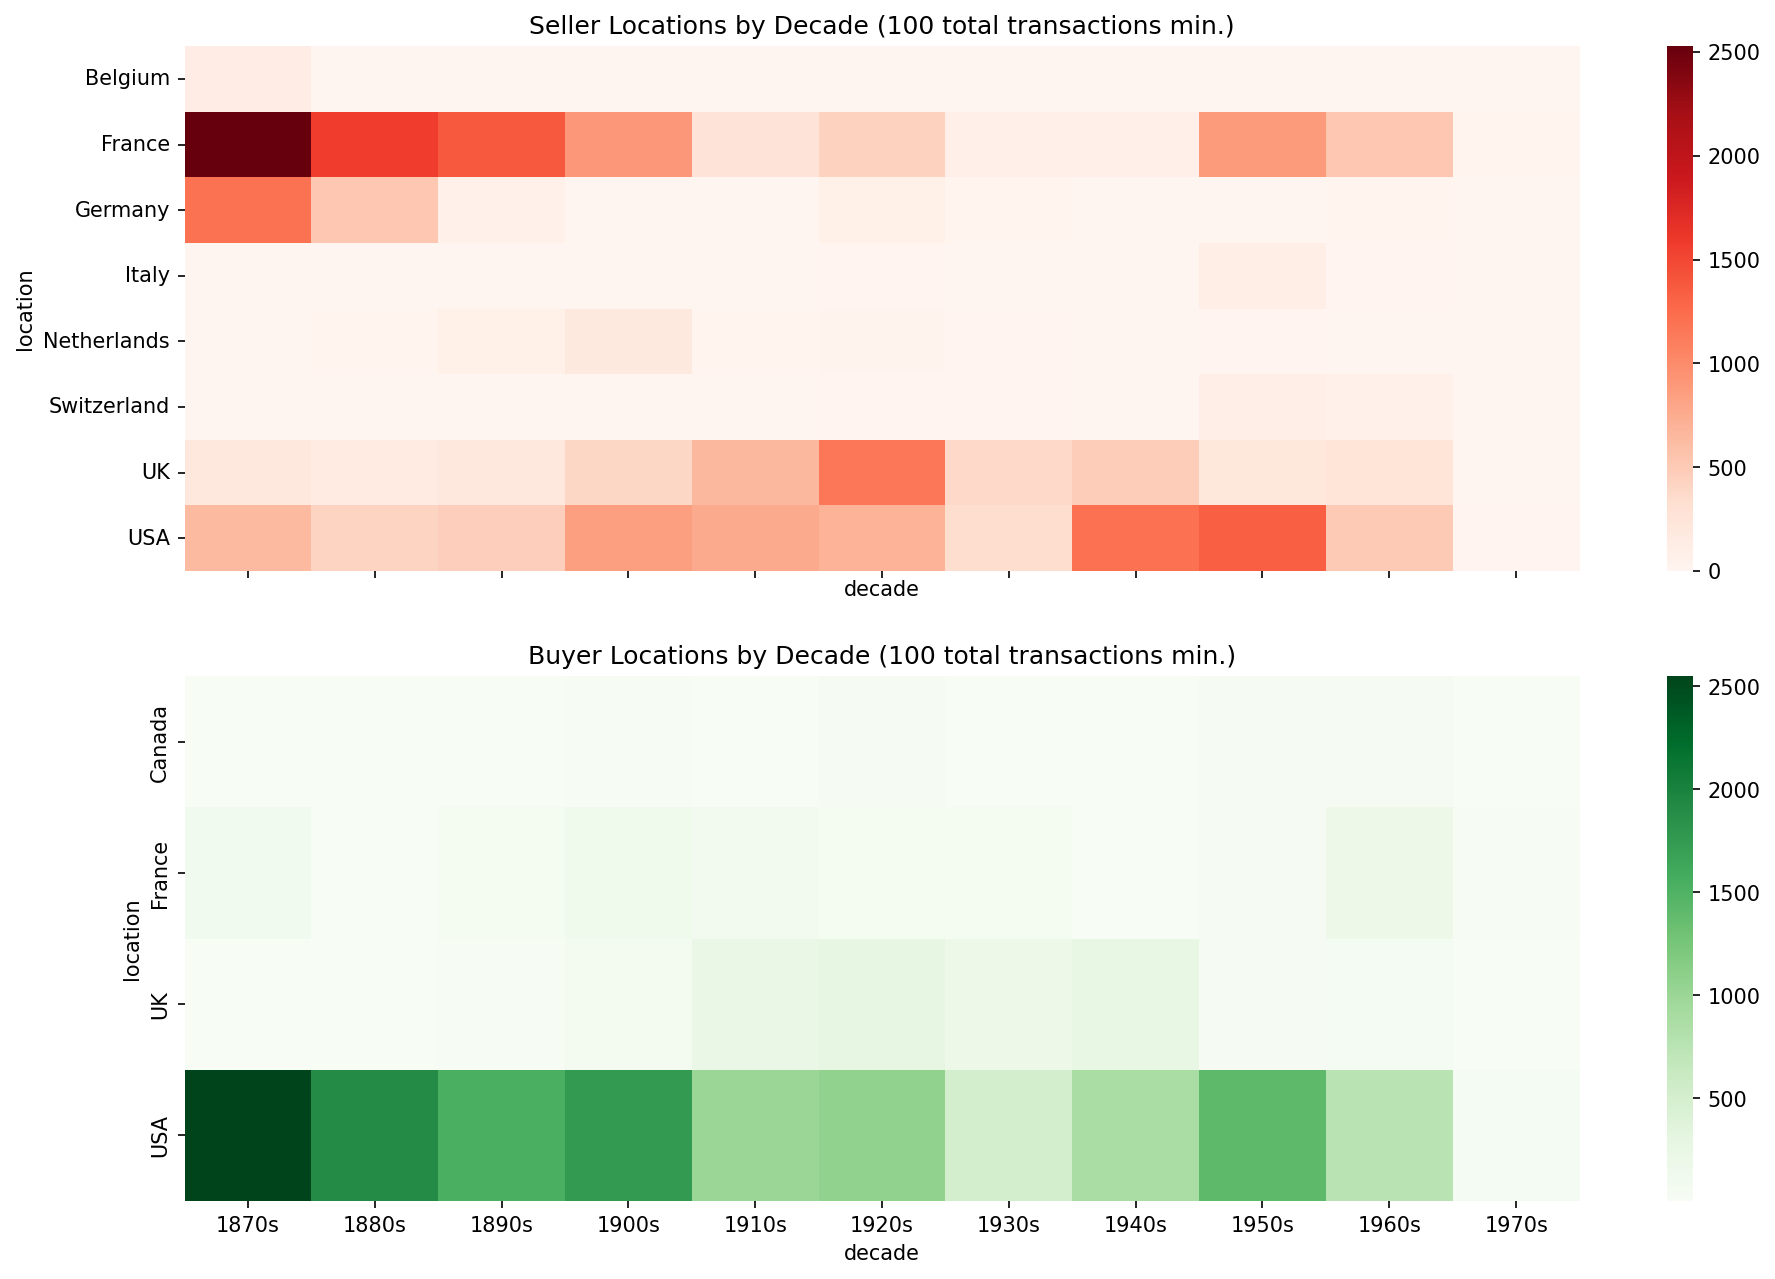
This is very useful: we immediately get a sense of where Knoedler acquired its inventory based on seller locations (early on France and to a lesser extent Germany, and over the course of the 20th century increasingly the UK and the US); and likewise we get a sense of where Knoedler did most of its selling based, conversely, on buyer locations (the US pretty much).
We could look at the same data in a line chart, which might clarify the changes over time to an even greater extent.
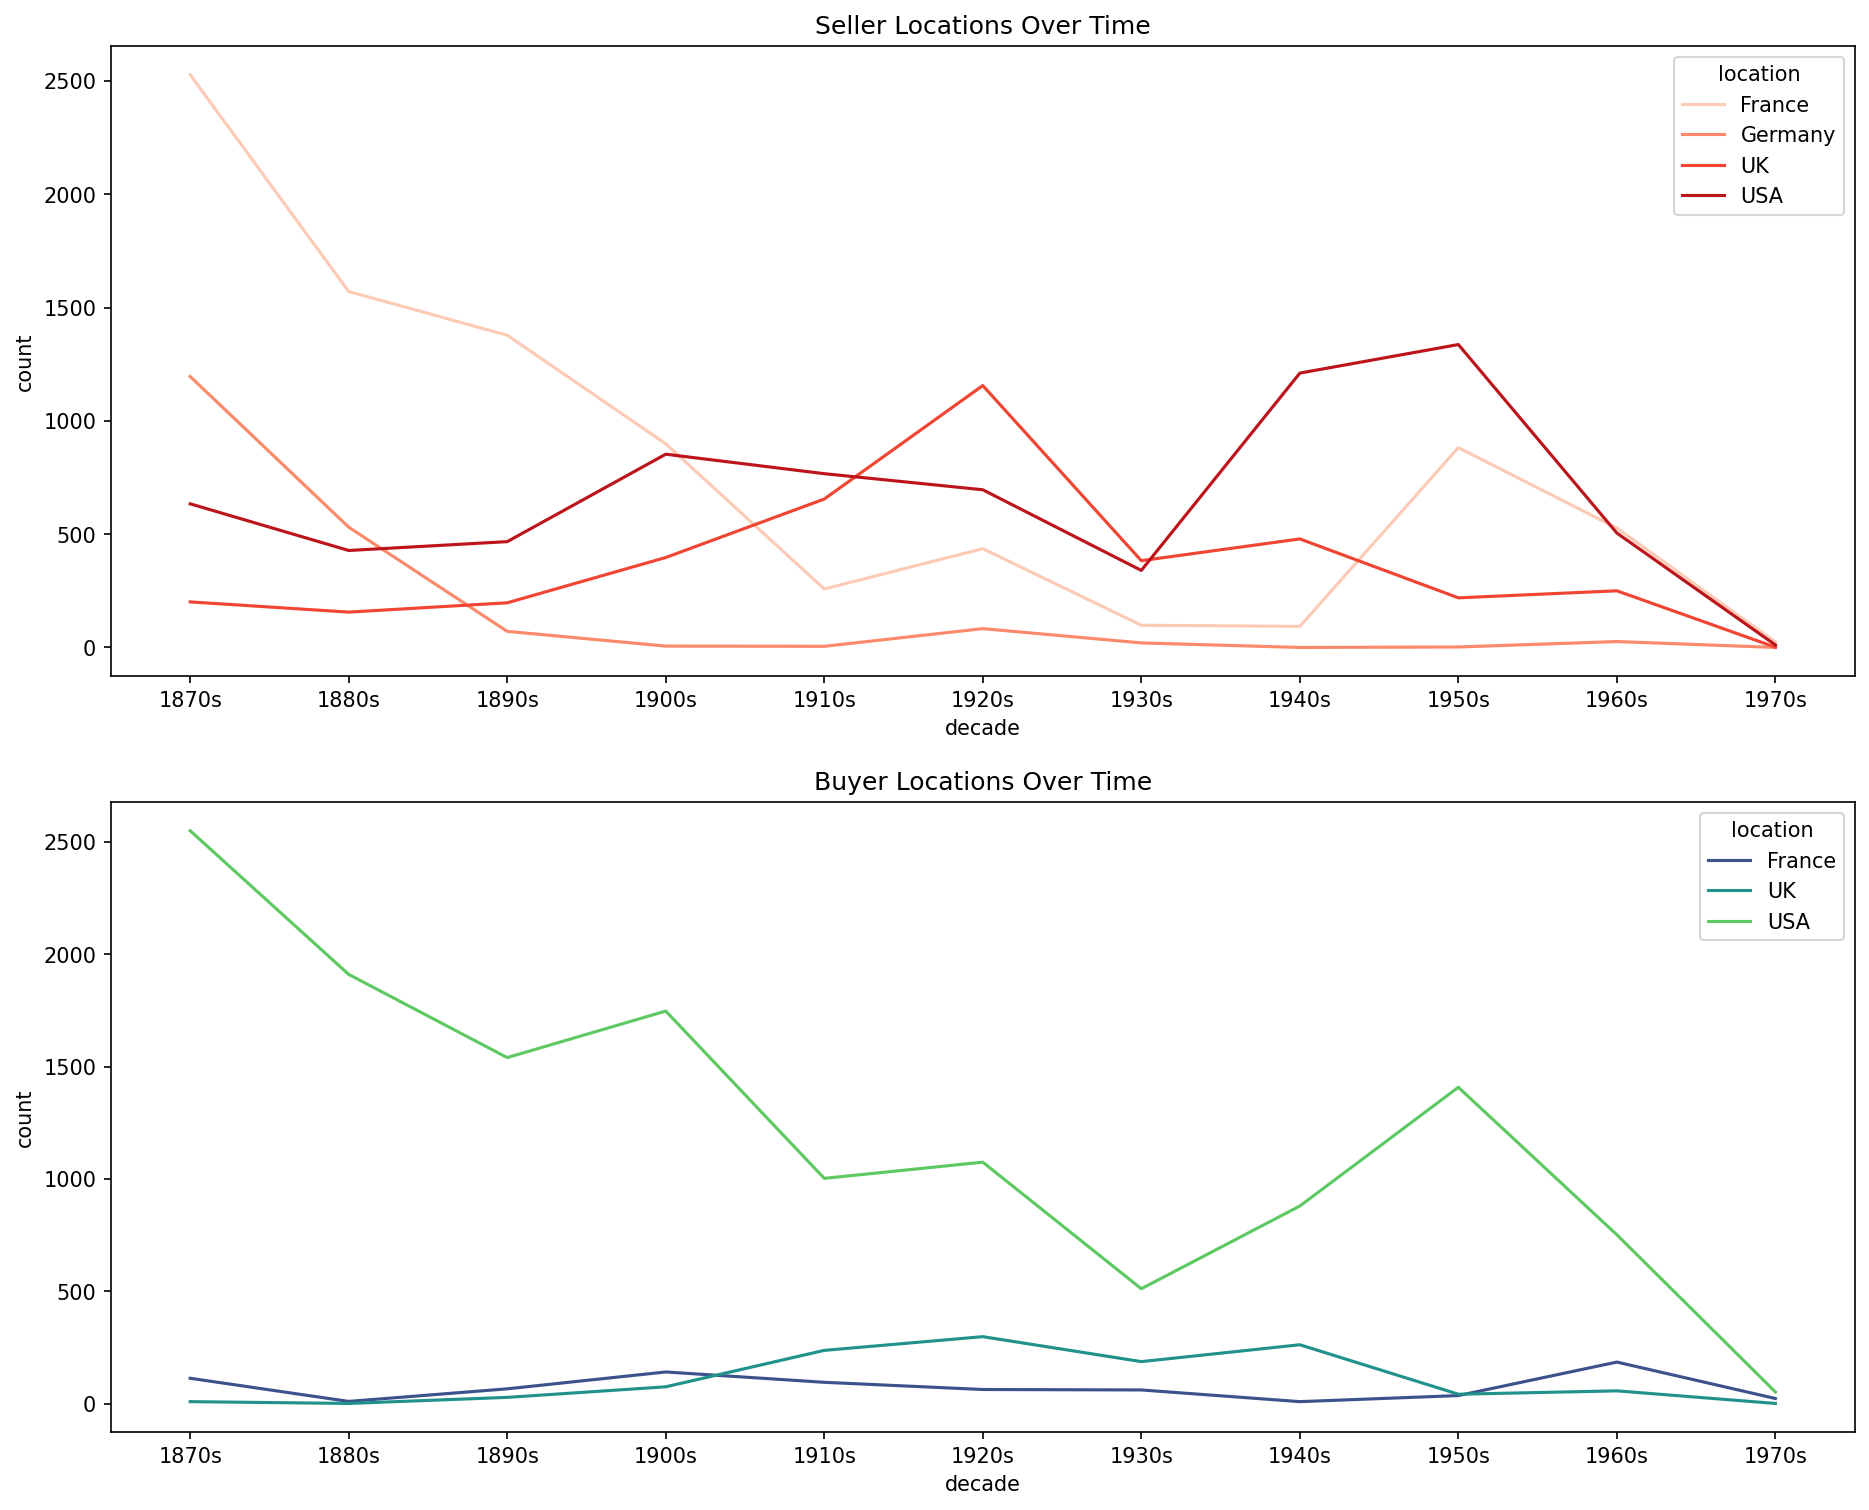
In terms of seller locations (i.e., where Knoedler acquired its inventory), we can clearly see that France was, early on, the main origin point until the turn of the century. After that there are some notable moments: a spike in UK acquisitions in the 1920s, the expected lull in acquisitions, period, in the 1930s, and then in the 1940s and ’50s increased buying stateside.
The story is clearer when it comes to the dealer’s sales: buyers were almost exclusively located in the US, as expected.
Buyer and Seller Locations: Trends Over Time (as Percentage)
Because the above charts indicate a decreasing transaction volume over time, it’s slightly difficult to get a clear sense of how these transactions relate proportionally, that is, as a ratio of all transactions in a given ten-year span. So I’m curious to think about buyer and seller locations as a proportion of all transactions, which would provide a better sense for how the composition of the dealer’s clientele, both on the buyer side and seller side, change over time.
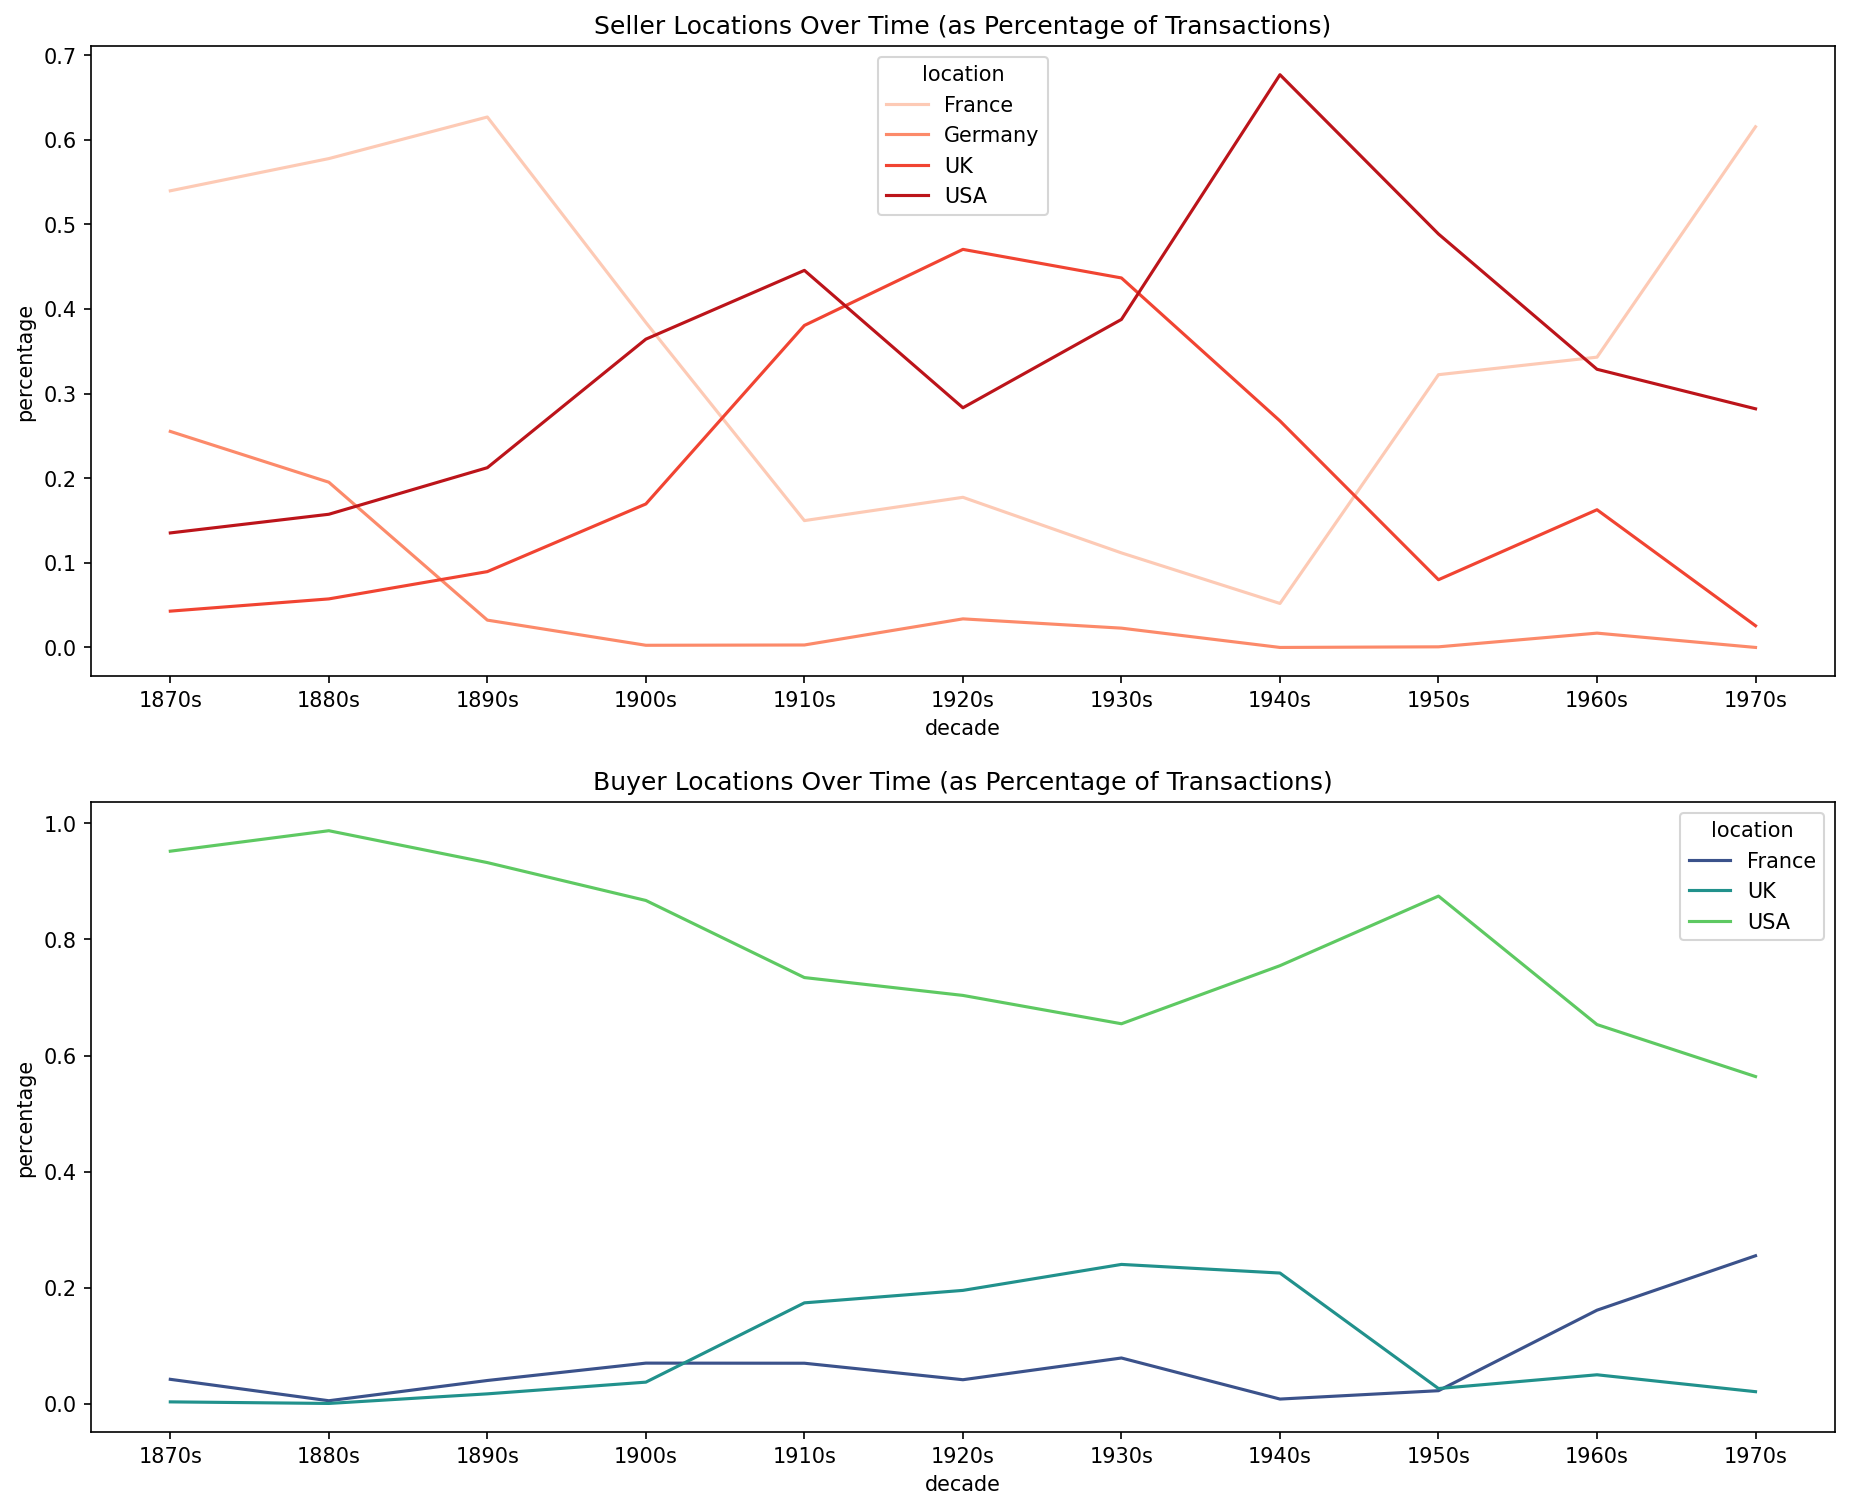
I think these charts are useful, since they help us obtain a bit more nuance about how the composition of Knoedler’s clientele changed over time.
When Knoedler was adding to its inventory, we can see that early on France accounted for over half of its incoming transactions. By the turn of the century, Knoedler was increasingly relying on the UK and the US when sourcing artworks. And in its final decade, France began once again to account for the majority of its acquisitions.
When Knoedler was selling, on the other hand, we can see that the vast majority of works were placed in the US. Interestingly, however, the largely decreased around the turn of the century as Knoedler increasingly placed art in the UK and, in its final decades, in France.
Origin-Destination Pairs
The last question I want to tackle here is to get a sense for specific vectors of travel—not only where Knoedler’s inventory originated and ended up in aggregate, but specifically where objects from, say, the UK tended to end up.
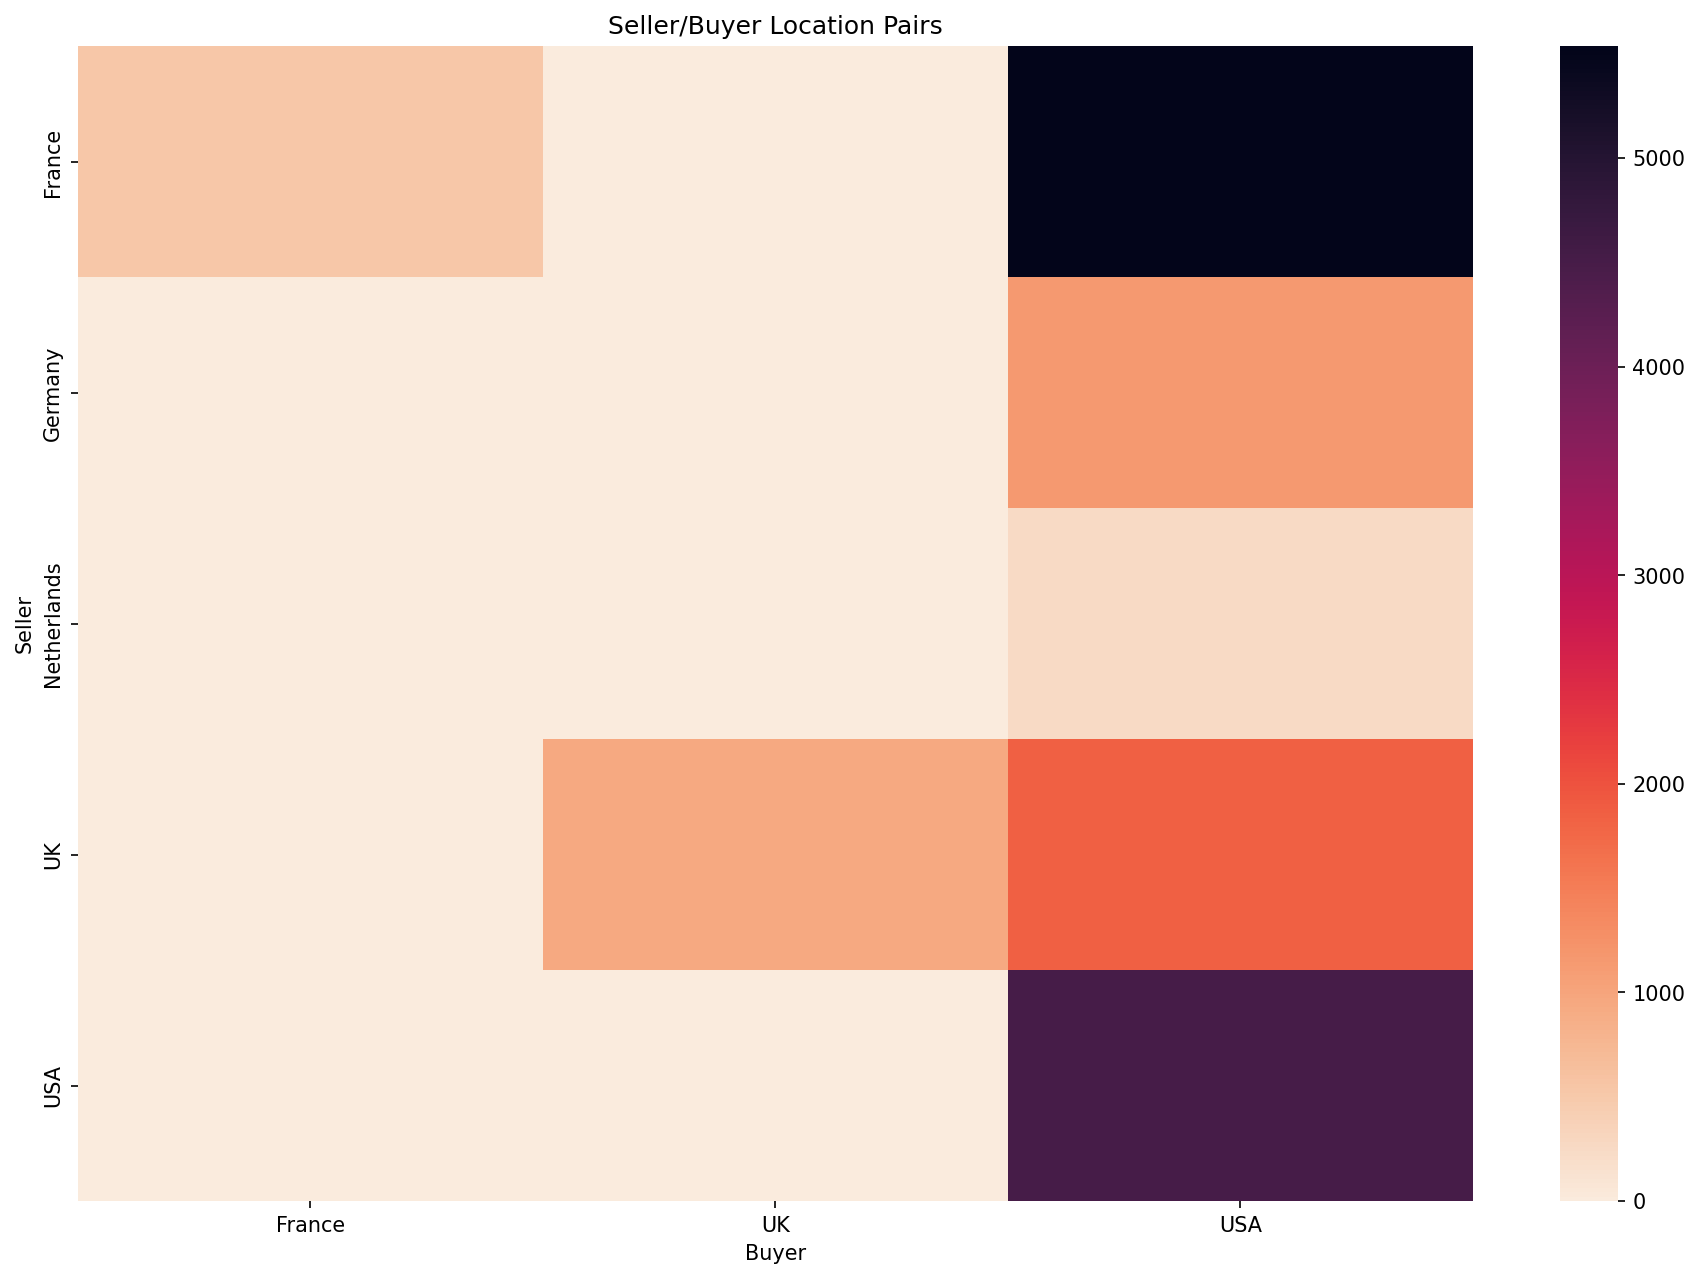
Now we can see the results a little more clearly. When artworks ended up in France, they seem to have originated in France; same goes for the UK. And as for artworks placed in the US, we clearly see that these originated mostly from France, followed by the US, the UK, Germany, and the Netherlands.