
Knoedler Stock Books: Transactions by Volume
In this series of posts, I delve into the Getty Research Institute's Knoedler Stock Books dataset, which contains over 40,000 sales records from the stockbooks of art dealer M. Knoedler & Co. dating from 1872–1970.
Assessing Activity by Sales Volume
I’ve been curious to explore some art history-related datasets, so I thought I’d start with the Getty Research Institute’s Knoedler Stock Books, which contains over 40,000 sales records from the stock books of art dealer Knoedler & Co., which have been painstakingly transcribed. I’m not familiar with the dataset yet, however, so I’ll start by answering a simple question that will give us a sense of the scope of the data. Based on when Knoedler acquired and sold artwork, when was the dealer most active?
Preparing the Data
As is, this dataset has much more than what we need to answer the question at hand. It’s got 89 variables to encode the various kinds of datapoints that occur in the handwritten stockbooks: The expected things–artist name, acquisition date and amount, sale date and amount–as well as other details–names and locations for both buyers and sellers, details about whether the work was jointly owned or not, provenance details, any verbatim notes, consignment details. All we need to know, though, is the year a given artwork was inventoried (entry_date_year) and the year it was sold (sale_date_year). So my approach was to count the sales per year (group by sale_date_year) and count the acquisitions per year (group by entry_date_year), and then generate some moving averages to smooth out the turbulance.
The Result
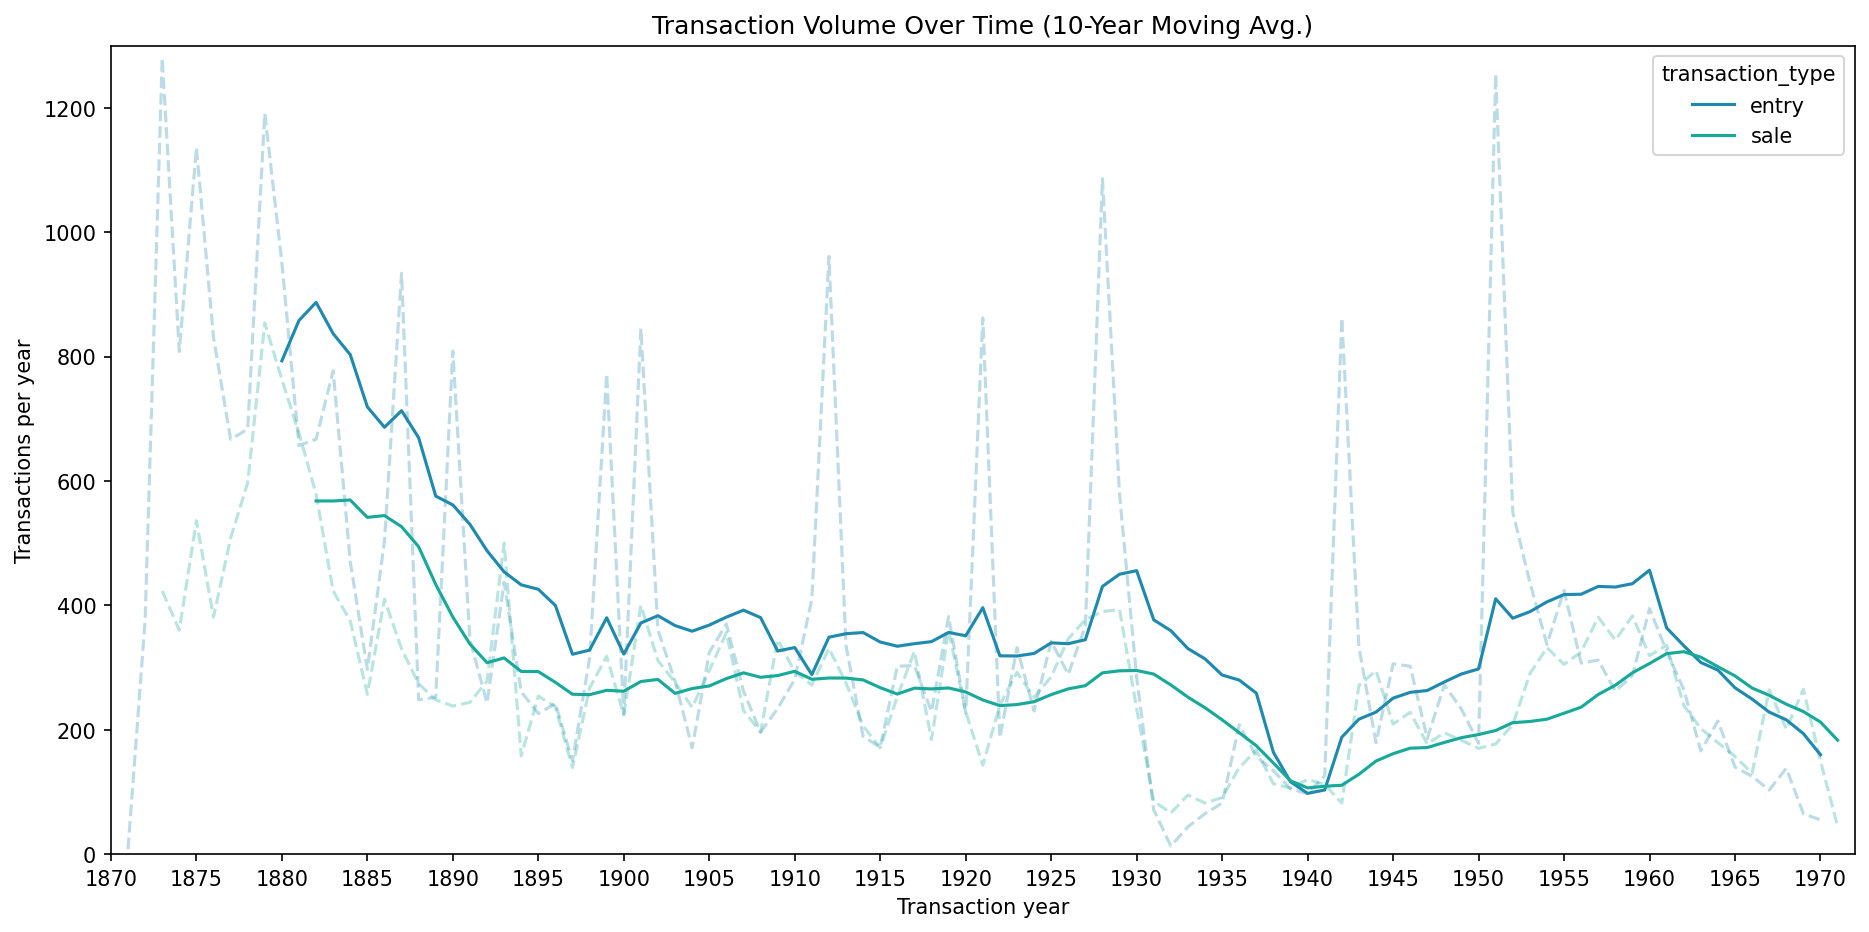 Now we have a sense for Knoedler’s transaction trends over time by volume, that is, measured in terms of transactions per year. Here’s what we can see:
- There’s a peak in activity early on in the 1870s
- On average, activity settles to a consistent level by the turn of the century
- There is an abrupt drop in activity during the Depression before a slow recovery to pre-Depression levels
- In general acqusition activity is much less consistant than sale activity, seemingly occurring in spurts every five or ten years
- On average, acquisitions outpaced sales, until around the 1960s, which is perhaps when the business began to unwind its inventory.
This is only part of the story, of course. For the art historian, this information helps identify deeper questions to ask. What was happening historically—in general and specifically in the context of the art market—that might explain Knoedler’s patterns of activity and inactivity? What explains the sporadic bursts in buying activity? How do these larger patterns of transactional activity break down according to geographical markets or invididual artist markets?