
Knoedler Stock Books: Destinations
In this series of posts, I delve into the Getty Research Institute's Knoedler Stock Books dataset, which contains over 40,000 sales records from the stockbooks of art dealer M. Knoedler & Co. dating from 1872–1970.
Mapping Artwork Destinations in the U.S.
Since re-confirming the fact that the vast, vast majority of Knoedler’s sales occurred with US buyers, I thought it would be interesting to get a bit more granular with the destination data and have a look at where specifically Knoedler works ended up in the US. Probably no surprises here—I presume we’ll largely see New York City followed by other large US cities. All the same, it may very well be illuminating to see these sales mapped out.
Technical Approach
In my last Knoedler-related post, I extracted country names from the buyer locations field that I cleaned up. However, this field also contains city and state information, as well. And using the GeoPy library that I discovered, I can use this City, State, Country location information to generate coordinates, which is what I’ll use to visualize the data. So, I’ll extract the unique US locations from the Knoedler dataset, use GepPy to generate coordinates for each of these, and then merge the resulting coordinates with the original dataset. This way I’ll dramatically reduce the number of API calls I need to make using GeoPy.
Artwork Destinations: Entire U.S.
Here’s the result using Basemap as a visualization library.
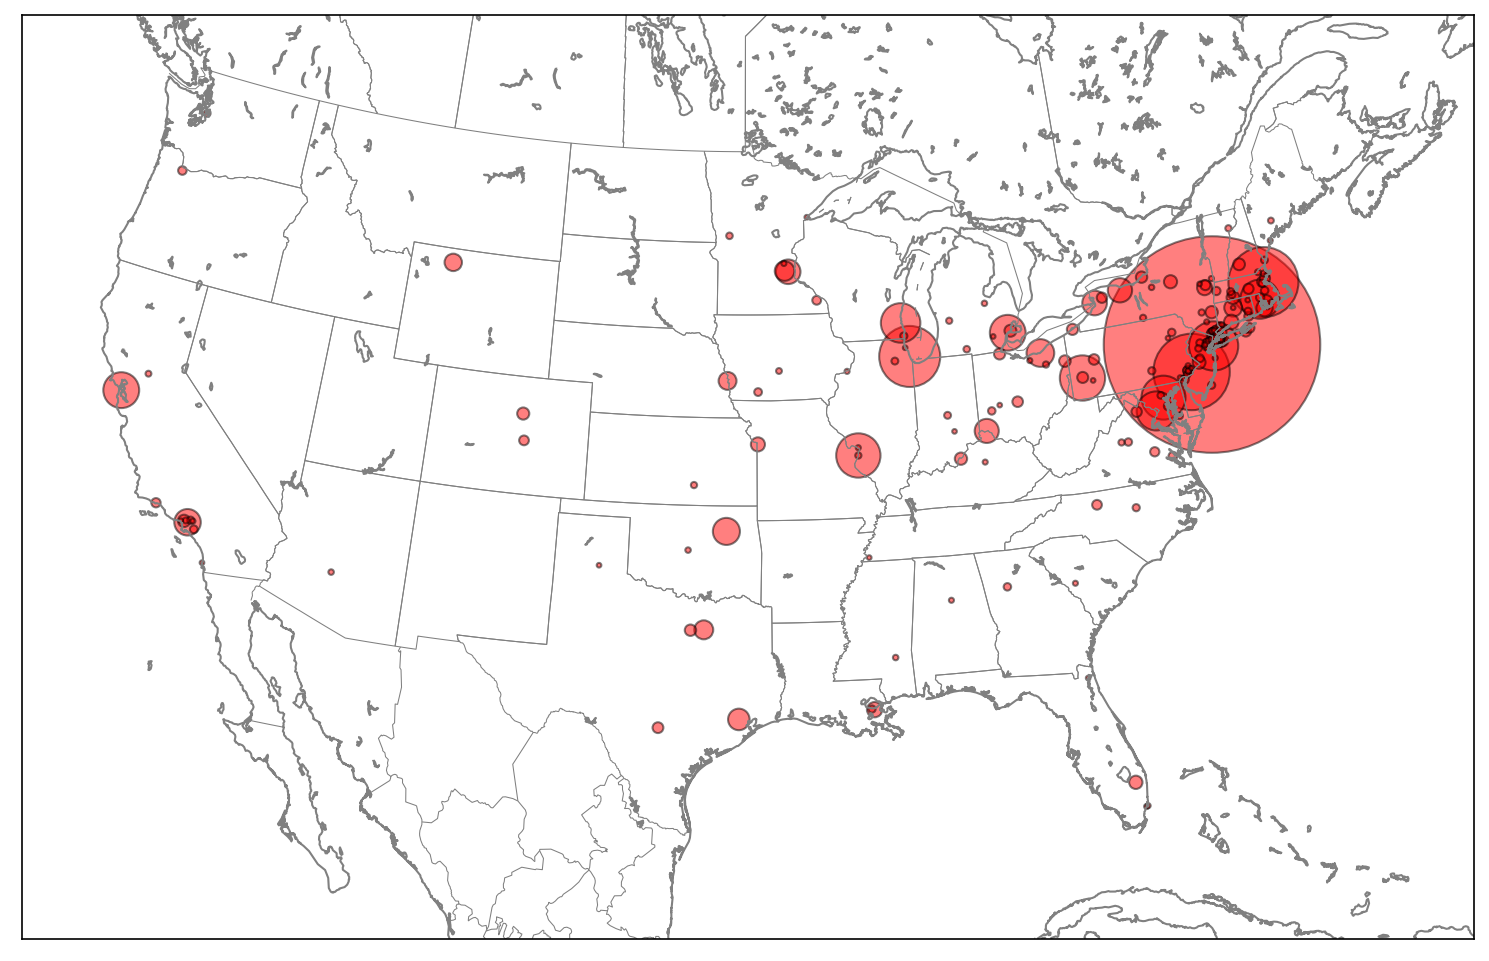
Zero surprises here, I suppose. Although it is interesting to have the geospatial representation and to see the thick East Coast cluster of buyers.
Artwork Destinations: Northeast U.S. (Excluding NYC)
Let’s zoom in a bit and narrow our query to cities with fewer than 10,000 Knoedler buyers (to exclude NYC) and more than, say, 10.
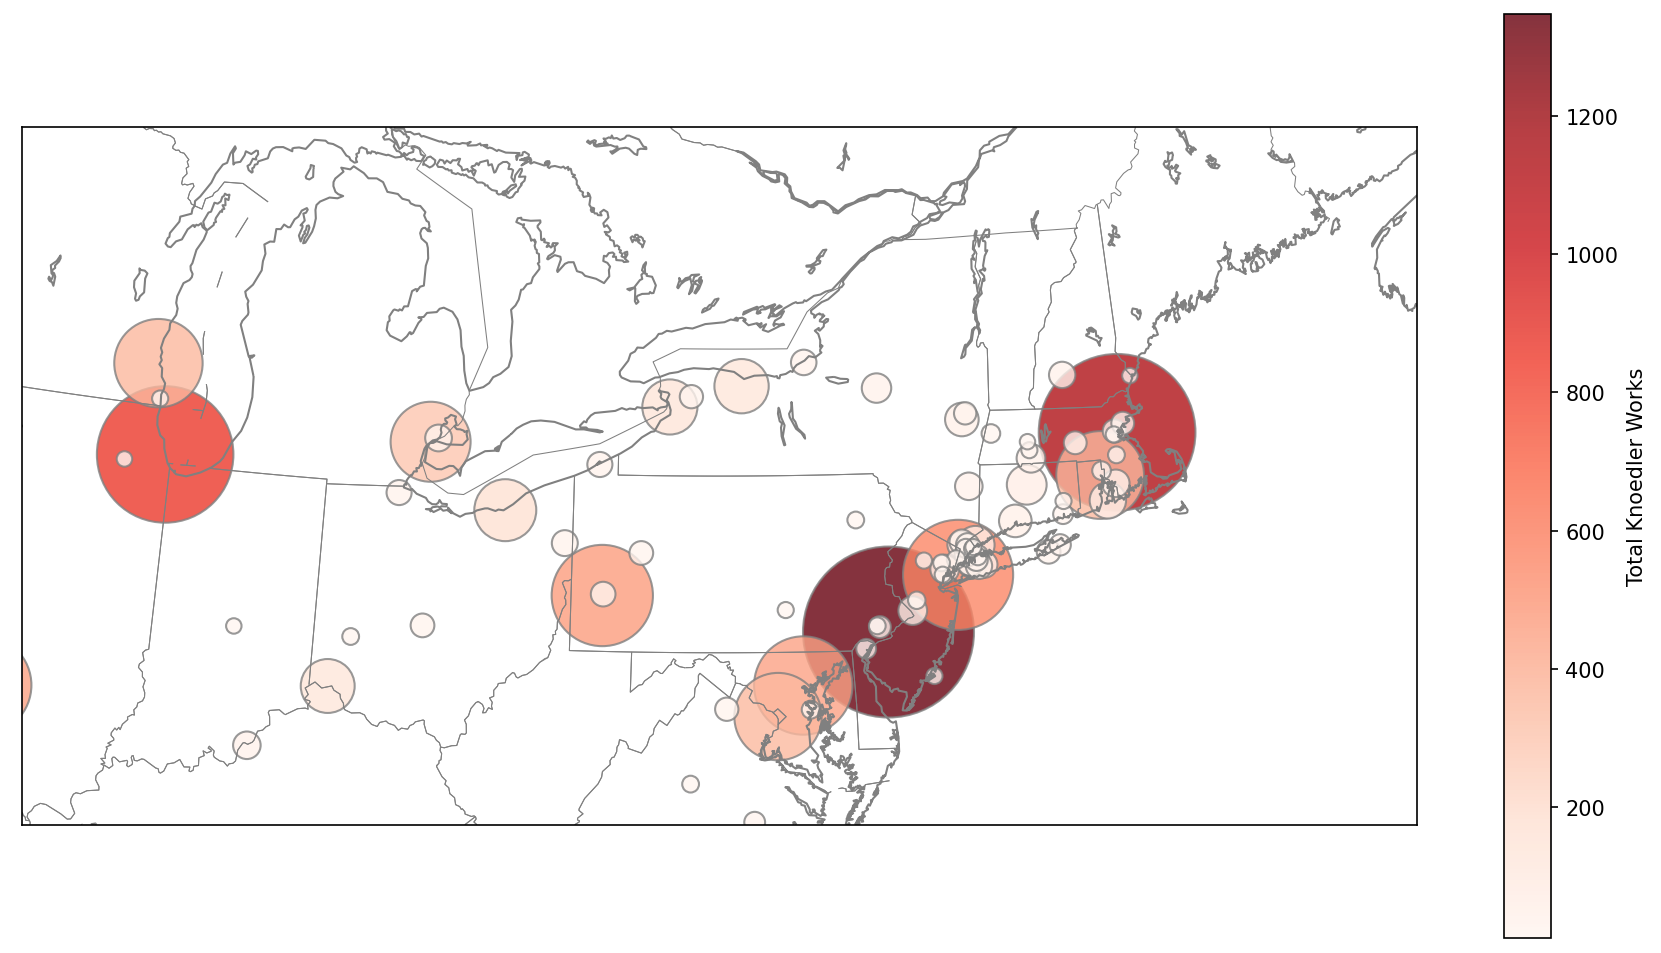
All in all, not a wealth of brand new information here. It is interesting to the clustering of smaller locations around big cities like New York City, Philadelphia, and Boston, which, if anything, suggests an even more dramatic skew towards these major metropolitan areas.